
Game analytics · Part 08 of 8 · August 24, 2026
A Correction That Worked Until the Model Under It Changed
Written to a disclosure policy: errors, rankings, biases and coverage are reported as measured; totals, prices and dates finer than a year are withheld, and the two titles are pseudonyms. Every figure traces to a named table, listed at the end.
The question
The composed chain is purely cohort by age. It has no term at all for the calendar month a forecast lands in. That was a conspicuous omission once the uncertainty attribution had found that a shared calendar-month shock dominates forecast variance at every horizon while cohort-level uncertainty is the smallest component. A model with nothing to say about the largest source of variation is leaving the obvious improvement unclaimed.
So the question was simple: does a calendar-period correction help? And, if it does, is the month effect a level — a constant offset the chain tends to run high or low by — or a process with dynamics worth modelling?
The answer changed under me. It helped. Then an unrelated fix upstream removed the thing it was helping with, and it stopped. This essay is short because the result is a reversal, and I think the reversal is worth more than the result would have been.
Why a month effect is harder to isolate than it looks
The chain’s forecast for a calendar month is the sum of many cohorts at different ages. If the whole sum runs high in a given month, there are two candidate explanations. Something about that month moved every cohort together — a promotion, a seasonal dip, a platform event. Or the cohort model itself has a systematic bias that accumulates with horizon, and what looks like a month effect is the bias showing up on the calendar axis.
These are hard to tell apart from the residuals alone, because both produce the same signature: a correlated error across cohorts in the same month. The only way to distinguish them is to change the cohort model and see whether the “month effect” survives.
My approach
The month effect is read off the chain’s own one-step errors: log(actual / forecast) at one month ahead is the part of that month the cohort structure
did not explain. The correction is the mean of that series over months at or
before the origin, refit at every origin, applied multiplicatively. That is a
constant level correction, and it is the version that shipped for testing.
Before settling on a constant, I fitted autoregressive orders one through six
on the same series and scored each against the intercept-only version, to see
whether the month effect had persistence worth modelling. Origins with under a
year of error history are skipped, so the earliest part of the panel does not
contribute (calendar_term__calendar_term).
The assumptions doing the heavy lifting
The correction is multiplicative in logs. It assumes the offset is proportional rather than additive. Untested against an additive alternative.
A calibration, not a mechanism. It corrects the chain using the chain’s own historical errors. It says nothing about why a month runs high or low, and it cannot anticipate a shock — only the average tendency to over- or under-project.
The error it corrects is stable. This is the assumption that failed, and it is the whole essay.
Where reality became inconvenient
When I first measured it, the composed chain aged cohorts on a chained month-over-month decay. That basis compounds its errors: its bias was positive and grew monotonically with horizon, reaching roughly double actual at twelve months. Against a bias of one sign that grows steadily, a single multiplicative shift helps a great deal — and it did, by about twelve percent at three months.
Then the basis mismatch in the composition was fixed. The chain had been
hardcoding decay while its own selection chose survival; once it ran the
survival basis it actually selects, which does not compound, the bias changed
shape entirely. It now runs negative at short horizons and positive at long
ones: −0.174 at one month, −0.141 at three, −0.076 at six and +0.185 at
twelve (calendar_term__calendar_term, none row).
No constant can correct a bias that crosses zero. Applied to a forecast running 17% low at one month and 19% high at twelve, one shift makes at least one end worse. And that is what happened.
So what had looked like a calendar-period effect was mostly the previous basis’s compounding bias wearing a period-shaped disguise. Fixing the basis removed the thing the correction was correcting. This was the third time in a single stretch of work that fixing something upstream invalidated a result downstream — a synthetic benchmark figure, an error-by-era table, and now this — and it is why I have become suspicious of any calibration layer I have not re-derived since the model under it last moved.
What the estimates actually say
MAPE by horizon (calendar_term__calendar_term): without the correction
the chain scores 0.174, 0.146, 0.153 and 0.302 at one, three, six and twelve
months; with it, 0.175, 0.240, 0.314 and 0.687.
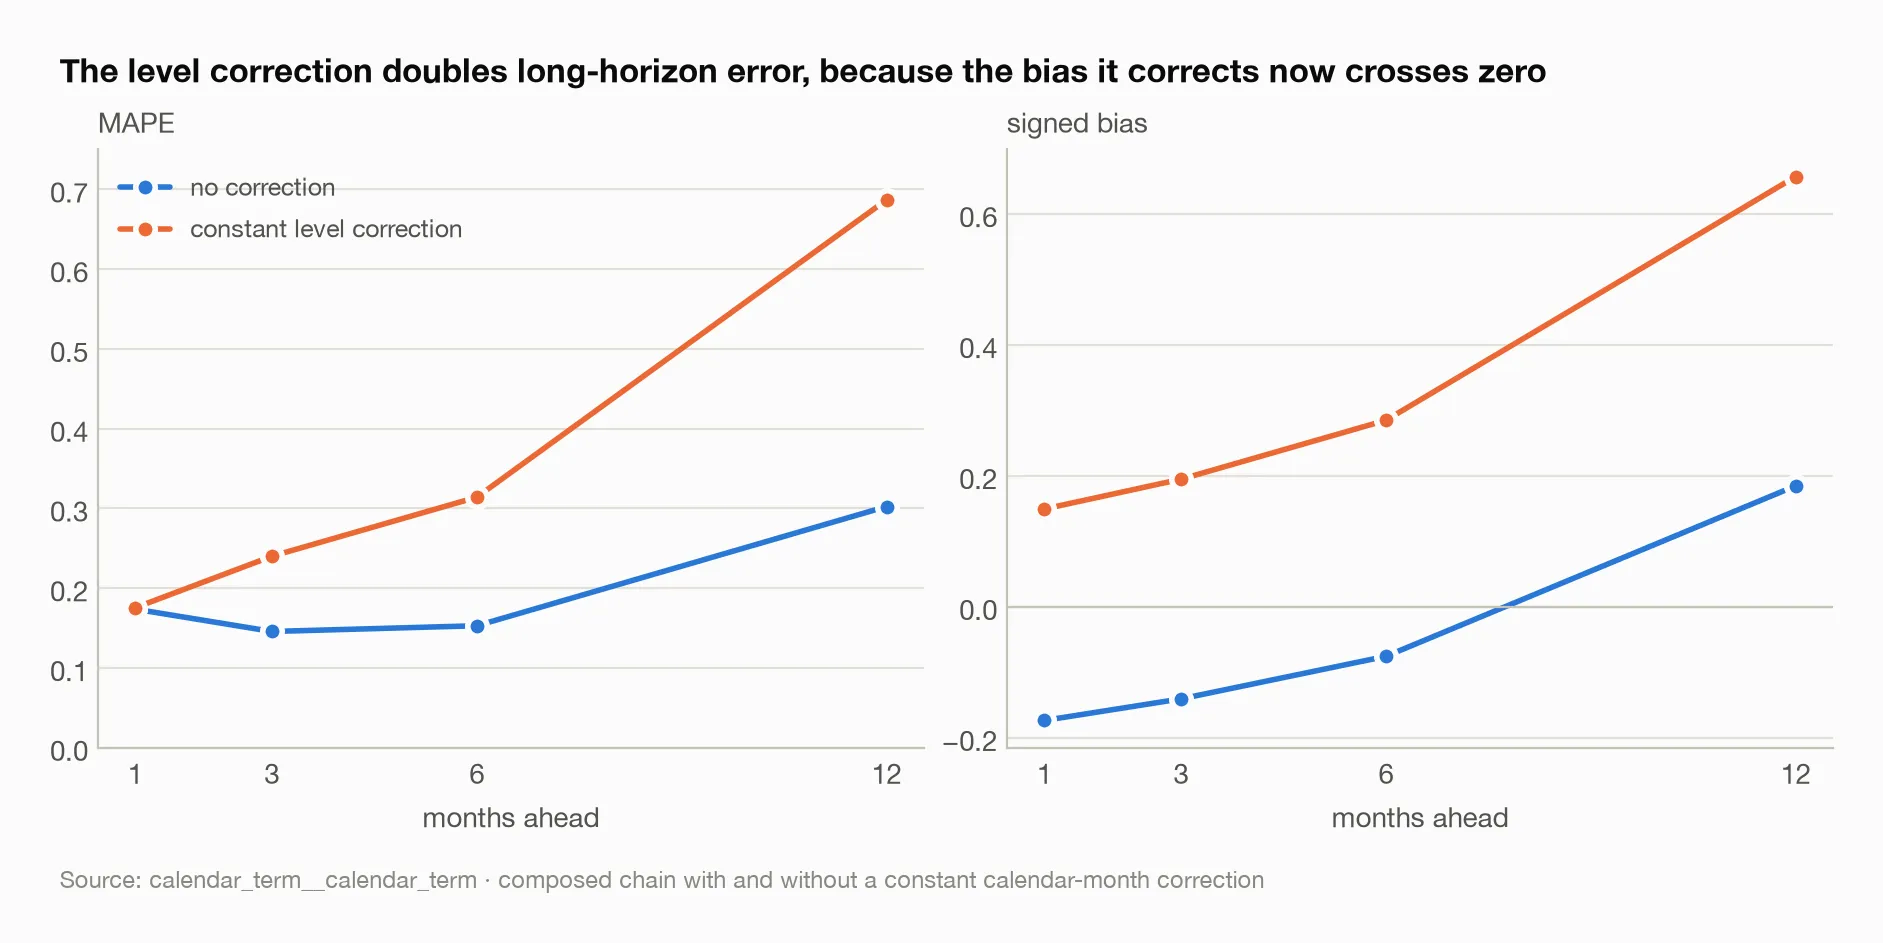
On the left, the corrected line is above the uncorrected one at every horizon past the first. On the right is why: the uncorrected bias starts below zero and ends above it, and a single upward shift moves the whole line into positive territory.
The correction is worse than doing nothing at every horizon past the first, roughly doubling the error at six and twelve months. It is not shipped.
On the dynamics, which were never there. Before the basis was fixed, none of the autoregressive orders one through six separated from a constant at any horizon. That result stands on its own terms and is why the code carries no autoregressive machinery: the chain anchors on the last observed month and has already consumed whatever persistence the month effect had. An explosive AR fit on a short series is not a bad fit; it is an unusable one, and the fits that came back explosive were exactly that.
This does not contradict the uncertainty work’s recommendation of an AR(1) on the calendar shock. That concerns the width of the prediction band, which draws a fresh unconditioned shock each time and is far too wide at short horizons as a result. The band and the point forecast are different objects, and the band’s version remains untested.
What I would change next time
Re-derive every calibration whenever the model beneath it moves. Not as a follow-up. In the same change.
Test on the second title before promoting anything. The month effect, its size and its lack of dynamics are all measured on one account. I did not get as far as replication because the correction failed before it got there, but the standard would have applied.
Model the shock as an input, not a residual. If the dominant source of variance is something the studio partly schedules — the live-ops calendar — then the useful version of a calendar term is not a correction fitted to past errors. It is a term that reads the promotion calendar.
Try an additive form. A bias that crosses zero might still be correctable by something that is not a single multiplier — a horizon-dependent offset, say. I have not tried it, and I am not confident it would earn its parameters.
The broader lesson
The correction was doing real work. It was just working on a problem that had another cause, and when the cause was fixed the correction became a liability. There is nothing unusual about that; it is what a calibration layer is. What I had not internalised is how quickly a fitted correction turns from asset to error when the model under it changes shape, and how plausible it continues to look in the meantime.
The variance decomposition still says the calendar shock is the largest term. That has not changed. What changed is my understanding of what a “calendar term” fitted to residuals can and cannot capture. It captured the model’s own bias, because that was the largest thing in the residuals. The actual shock — the promotion, the season, the platform event — is still in there, and a correction that cannot anticipate it has not touched it. The largest source of uncertainty in this forecast is a thing the studio partly knows in advance and the model has no way to be told.
Sources
Every figure above traces to this table:
calendar_term__calendar_term— MAPE and bias by horizon, with and without the correction